
RSV is an important respiratory virus, and preclinical rodent models can support evaluation of anti-RSV antibodies, small molecules and vaccine candidates. RSV and its chimeric strains affect infants, adults, elderly worldwide and cause significant morbidity. Aragen supports pharmaceutical, biotechnology and emerging life sciences customers with preclinical efficacy and early safety-related studies, where aligned to project scope. Appropriate in vivo rodent models enable development of anti-RSV antibodies, small molecules, and vaccines for the treatment of respiratory disease.
Infectious Disease Models available at Aragen
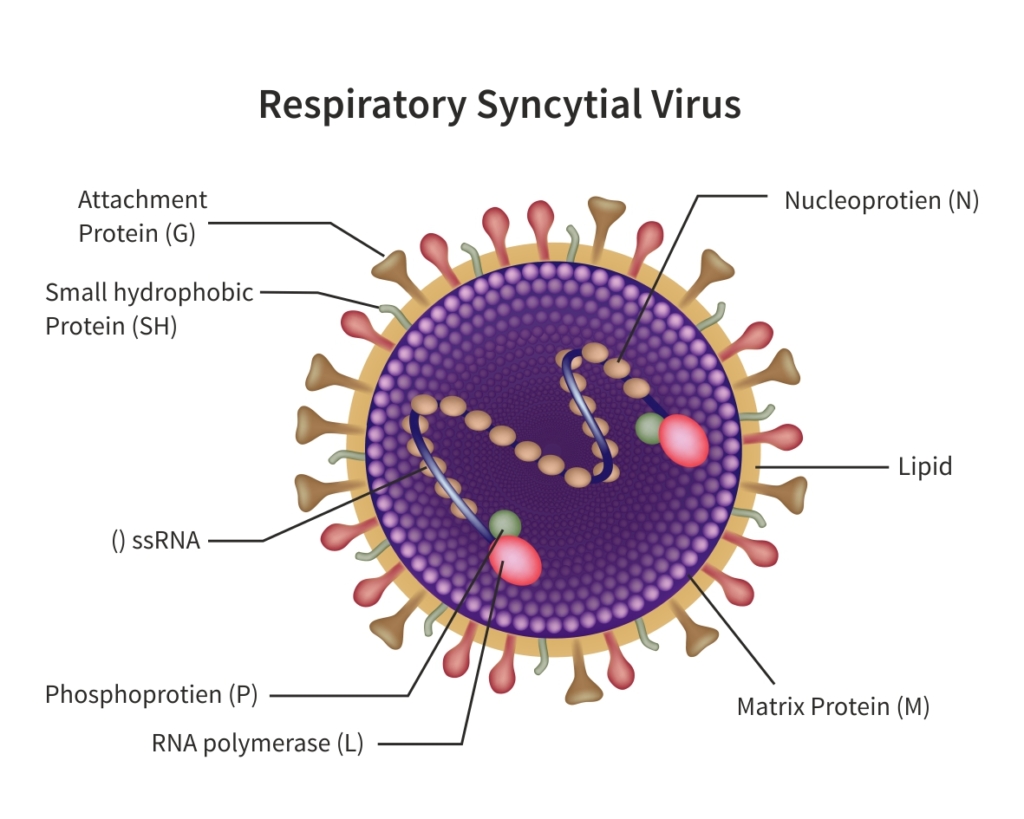
Presently, there is no targeted treatment available for human respiratory syncytial virus (hRSV) infection other than the supportive care to mitigate the signs of and symptoms. Antiviral drug development and RSV vaccine is expected to play a critical role in overall reduction of RSV infections globally. Continued effort in RSV research published in high profile scientific journals has invigorated efforts by larger and smaller pharmaceutical and biotechnology companies to develop antivirals and RSV vaccines. Preclinical development of vaccines is hindered by the lack of clinically relevant rodent models. More importantly, the safety of new vaccines, preclinical pharmacological, safety and toxicology studies should be conducted prior to initiating the clinical studies. Aragen will enable successful IND-enabling preclinical RSV therapeutic development studies by providing appropriate study designs, right animal models, and confirming effective immune response by performing in vivo and in vitro assays. Our scientists have and will continue to establish the identity, purity, safety, and potency of the vaccine or antivirals. In this white paper, we present several case studies performed in clinically relevant mouse and rat models to assess the critical characteristics of potential RSV therapeutics. In summary, this article includes in-house as well as client-sponsored study data developed over several years using rodent models. These studies generated clinically pertinent information for proper screening of new vaccines and antivirals. Aragen will continue to support your RSV therapeutic development effort by providing reliable and effective preclinical services in this important infectious disease area.
Model for anti-RSV therapeutic development. We offer preclinical efficacy and safety studies using appropriate in vivo rodent models to enable development of anti-RSV antibodies, small molecules, and vaccines.
What is Cotton Rat model for RSV?
The RSV mouse model is the preferred choice for most preclinical immunological studies, ranging from simple vaccine testing to the intricate assessment of fundamental immunopathogenic responses. Therefore, Cotton Rat model is one of the most clinically relevant models for anti RSV development.
How does our model work?
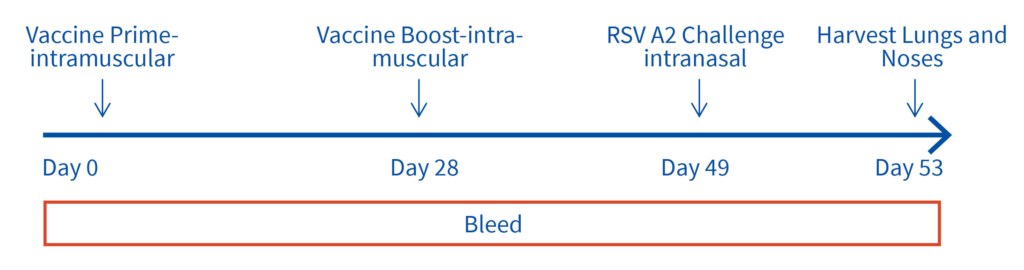
Female Cotton rats 6-8 weeks old will be infected with RSV-A2 Long (ATCC: VR-26), intranasally on day 2, observed daily for clinical signs. Test vaccine (day 0 and 28) and RSV challenge (day49). Bleeds on day 28, 49 and 53 for vaccine and RSV testing and tissues harvested on day 53 for ex vivo analyses.
Key Readouts:
Advantages of Aragen’s RSV platform and our Cotton Rat model:
Cotton rat is considered a more relevant animal model for preclinical studies on RSV infection than BALB/c mice. Consequently, cotton rats are used to study RSV pathogenesis, anti-RSV drugs, and RSV vaccine efficacy and safety. For example, the cotton rat model was used for pre-clinical evaluation of unglycosylated recombinant E. coli produced G protein (REG) as a potential RSV vaccine (3). A preclinical study showed that bacterially produced REG could provide an economical, safe and effective broad protective vaccine against RSV disease (3).
Case study : Non-GLP Study to Evaluate Prophylactic Efficacy of XXX Antibody Against Respiratory Syncytial Virus (RSV) Strain A2 in Female Cotton Rats
Objective :
To evaluate the efficacy of XXX antibody (drug) product in comparison to SYNAGIS (reference drug), in limiting viral replication of RSV (Strain A2) in lungs of female cotton rats. SYNAGIS is a prescription medication that is used to help prevent a serious lung disease caused by RSV in children.
Study Design :
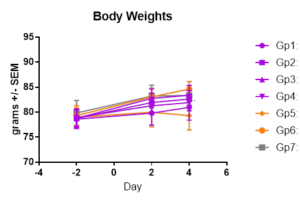
Thirty-five cotton rats (approximately 6-8 weeks old) separated into 7 groups (N=5/ group).
Gp1: Test Article (4mg/kg); Gp2: Test Article (2mg/kg); Gp3: Test Article (1mg/kg); Gp4: Test Article (0.5mg/kg); Gp5: Synagis® 4mg/kg; Gp6: Synagis® 2mg/kg; Gp7: PBS
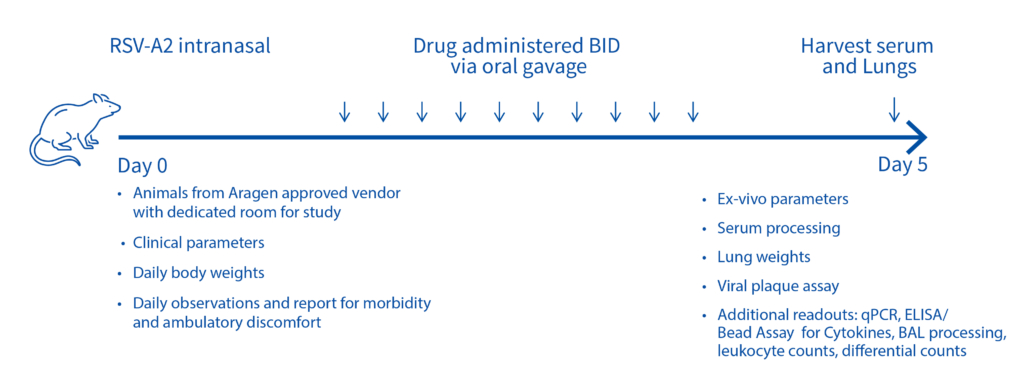
On day -1, rats received a prophylactic intramuscular injection of test article at 4 mg/kg, 2 mg/kg, 1 mg/kg or 0.5 mg/kg or they received a prophylactic intramuscular injection of the control antibody, Synagis® at 4 mg/kg or 2 mg/kg. On Day 0, all animals were inoculated intranasally with 1×10⁵ PFU of RSV strain A2. On day 4, serum, nose and lungs were collected following euthanasia and the viral lung titers were determined by plaque assay.
The test products and Synagis® exhibited dose-dependent antiviral activity in preventing RSV replication in the lungs of cotton rats infected with RSV A2. And treatment with test products (0.5 mg/kg, 1 mg/kg, 2 mg/kg or 4 mg/kg) significantly decreased viral lung titers compared to treatment with PBS (p<0.001). Furthermore, the test products decreased viral lung titers on average 16-fold more than the same dose of Synagis® (4 mg/kg group: p=0.021; 2mg/kg group: p<0.001).
Delivery : Timely completion of the project to the full satisfaction of the Client
Results :
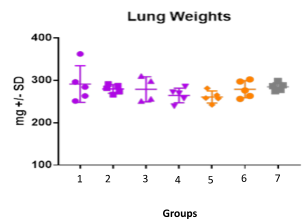
Case study : Effect of SYNAGIS® on RSV replication
Female BALB/c: 6 weeks old Intranasally injected with RSV strain: RSV-A2 Long (ATCC: VR-26) Left Post SYNAGIS® treatment on day 3, clinical observations done daily until tissue harvest on day 5 (Right)
Case study : Measurement of RSV replication in BALB/C MICE- Time Course
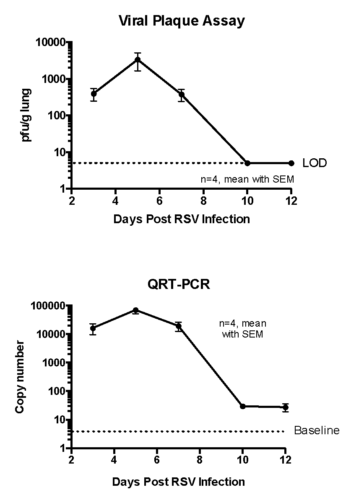
Female BALB/c: 6 weeks old were intranasally infected with RSV strain-RSV-A2 Long (ATCC: VR-26). The peak RSV replication was seen on Day 5 post infection. Live virus was not detected in lungs on day 10 post infection. However, viral RNA was detected at day 12 post infection.
Case study : Consistent bioassay performance across studies with RSV-A2
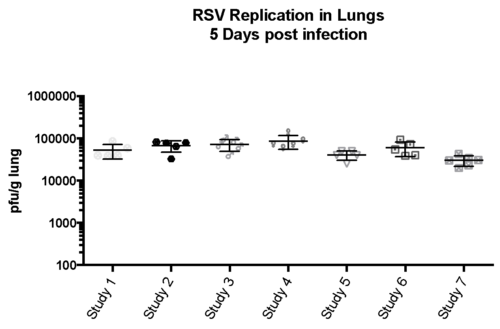
Female BALB/c 6-8 weeks old mice were intranasally infection with RSV-A2 (expanded from RSV-A2 ATCC stock (VR-1540), , tissue harvested on day 5 and Bio-burden investigated.
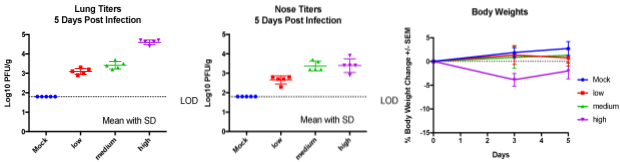
Case study : RSV replication in lungs and nasal tissues at varying RSV doses
Transient weight loss in female BALB/c, 6-8 weeks old mice intranasally transfected with varying doses of RSV measured and on day 5, lung and nasal tissues were harvested to measure RSV burden.
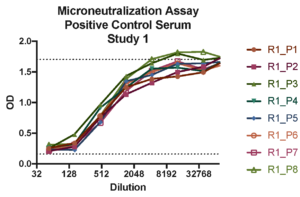
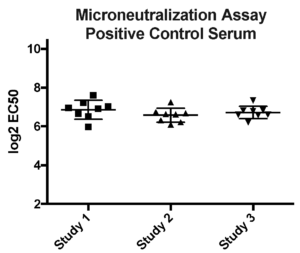
Case study : Vaccine development- RSV neutralization assays
Aragen participated in a WHO collaborative study to establish the 1st International Standard for antiserum to RSV. A positive control standard run on every plate in microneutralization assay. Options for microneutralization or plaque reduction assay was adapted to develop in- house or client’s protocols.
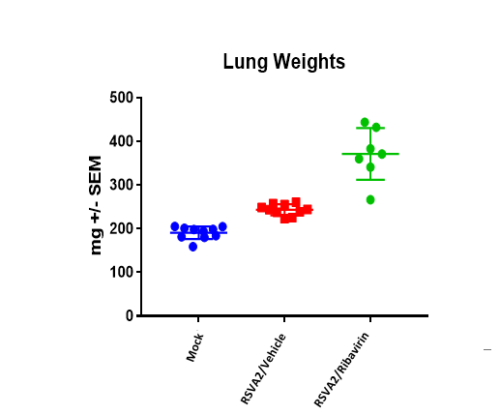
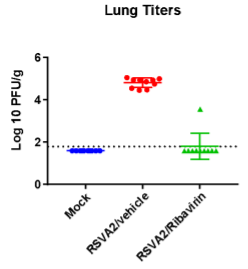
Case study : Effect of Ribavirin on RSV-A2 infection in 8-Weeks-old BALB/C female mice
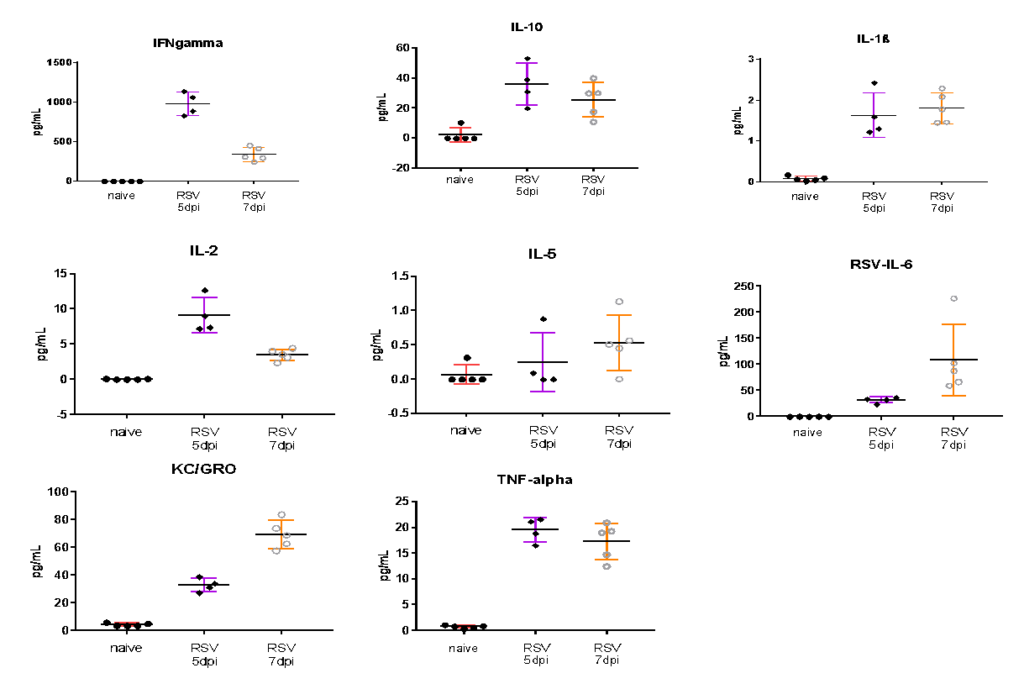
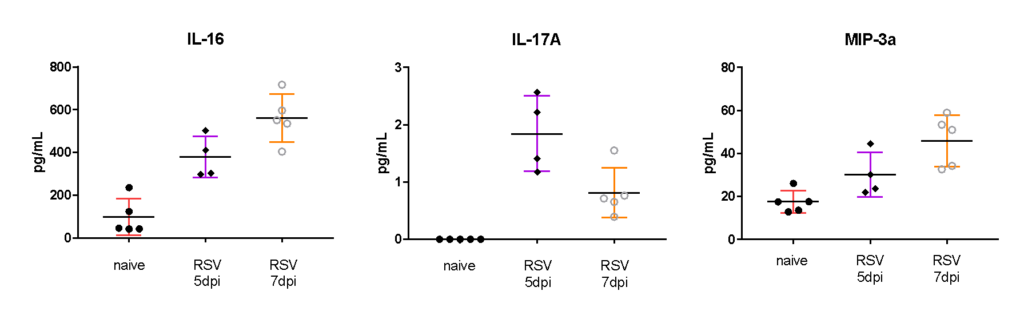
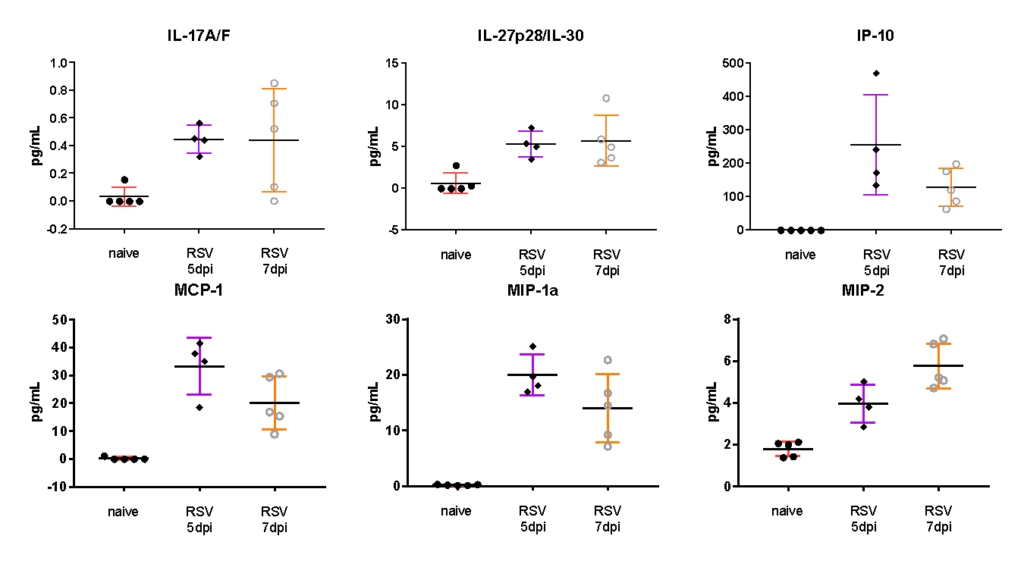
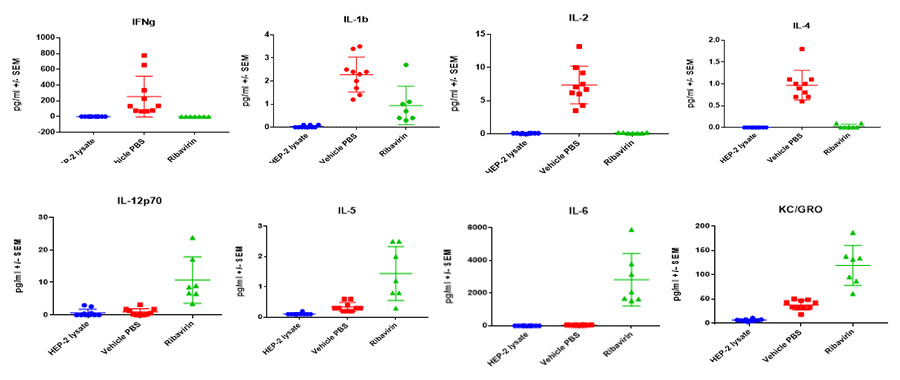
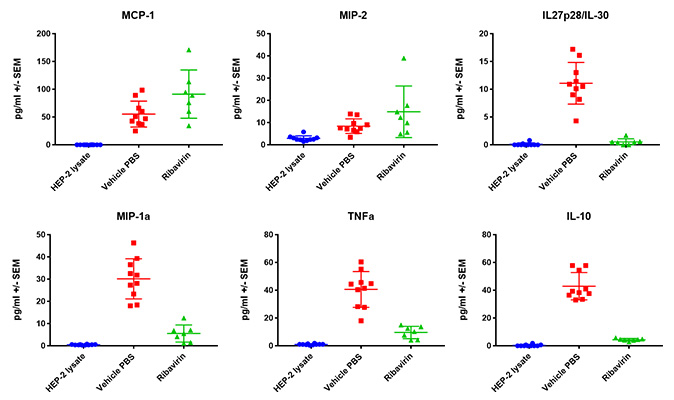
BAL cell counts and BALF MSD analysis using U-plex kit were performed in untreated and treated (Ribavirin) mice. Decrease in lung weights were slightly increased and RSV titter decreased in Ribavirin treated RSV infected mice compared to placebo (mock) group.
Case Study : Ribavirin In BALB/c RSV Model- MSD BALF Cytokine/ Chemokine analysis
Case Study : BAL Cell counts and differentials
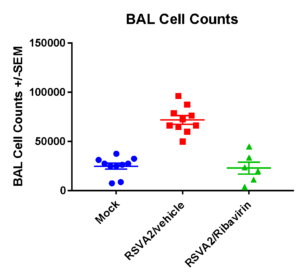
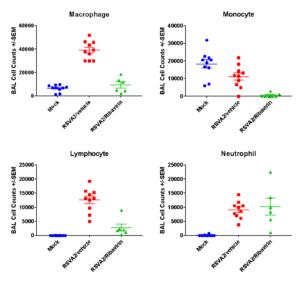
Case Studies:
Salient features
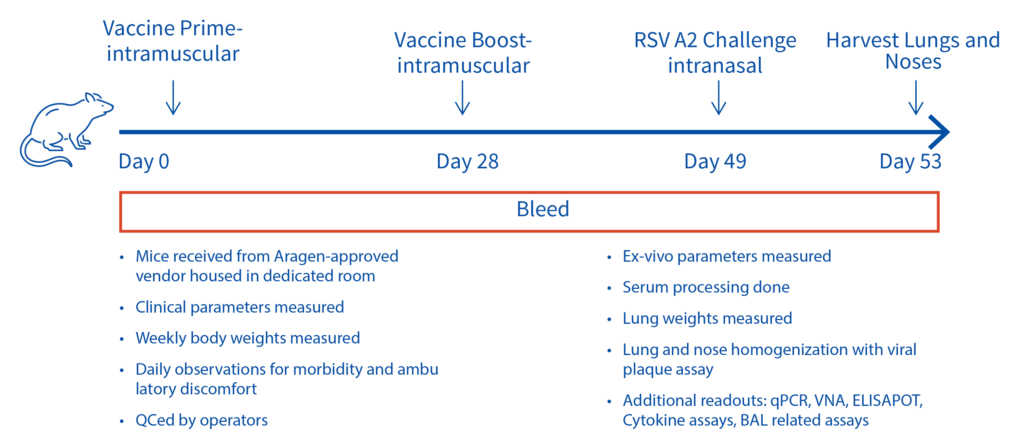
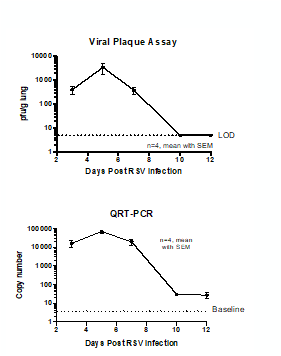
Ex vivo Assays performed:
Case Study : Lung and nasal turbinate titers in RSV-A2 infected cotton rats
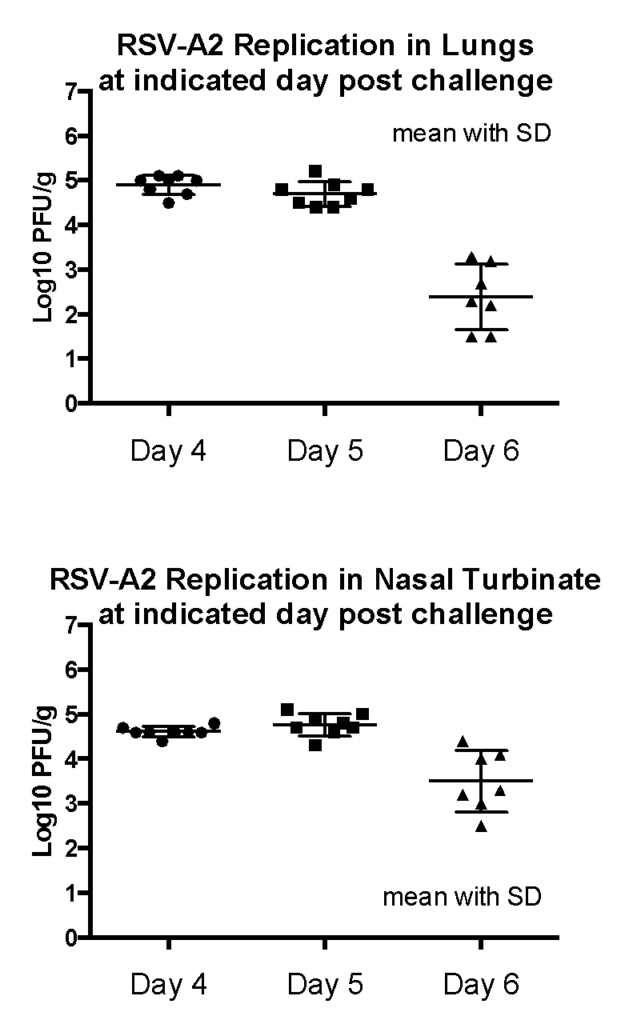
Female Cotton rats: 6-8 weeks old were intranasally infected with RSV-A2 (ATCC VR-1540), observed daily, harvested lungs and noses on day 4, 5 or 6 and viral plaque assay performed in homogenized tissue. Result: Peak RSV replication was observed on 4-5 days post infection.
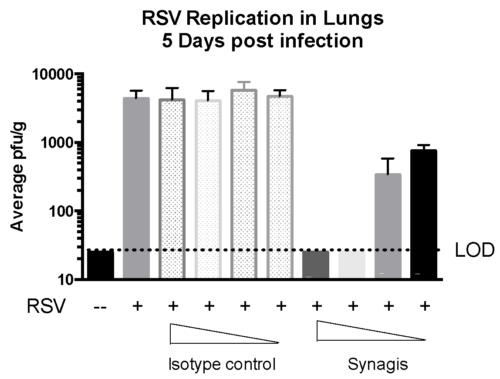
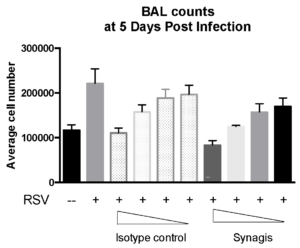
Case Study : Effect of SYNAGIS® on RSV replication in Cotton rats
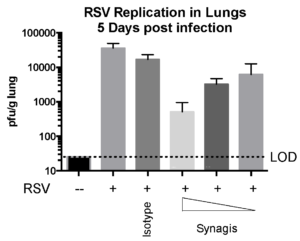
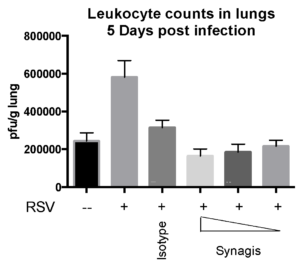
Female Cotton rats 6-8 weeks old were infected with RSV-A2 Long (ATCC: VR-26), intranasally on day 2, observed daily for clinical signs, tissue harvested on day 5 to measure RSV replication status and leukocyte counts. We observed that Synagis® reduced RSV replication and leukocyte count in the lungs.
Case Study : SCID mouse model to measure RSV-A2 replication
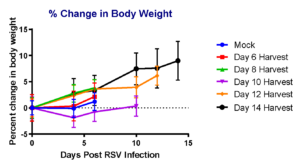
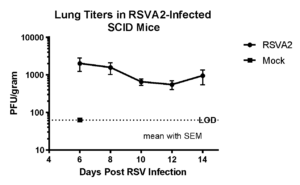
To measure the replication of RSV-A2 in immunocompromised mouse model, we intranasally injected placebo group with vehicle and test groups with RSV-A2 (1×10⁵ pfu), monitored body weight for over 14 days in different groups of mice before harvesting lung tissues for RSV measurement on days 6, 8, 10, 12 and 14 days. We observed that RSV-A2 replication was prolonged in SCID mice over 14 days compared to placebo (mock) group.
Case Study : Effect of Synagis® on RSV-A2 replication in SCID mouse model
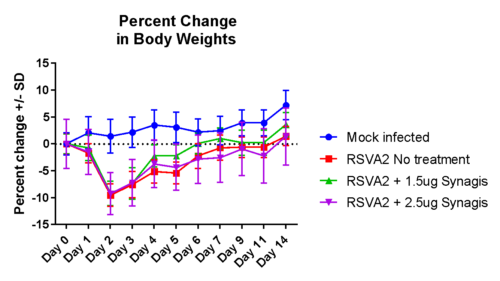
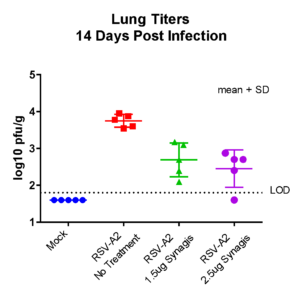
Female SCID mice, 6 weeks old were inoculated intranasally with RSV-A2 (1×10⁵ pfu), treated with Synagis® IP on days 2,4 and lung tissues harvested on day 14 for RSV burden analysis. We observed that RSV-A2 replication was prolonged and the administered doses of Synagis® provided partial protection against RSV infection.
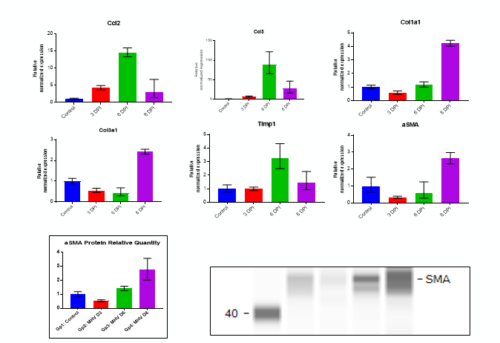
Recent reports implicate SARS-CoV infection in causing lung fibrosis through multiple signaling pathways and TGF-β activation (5,6). Aragen has developed a mouse corona virus model to study lung fibrosis, which most SARS-CoV-2 infected patients develop. This model can be studied with BSL-2 Containment to evaluate vaccines and antivirals for treating respiratory infection with Fibrotic effects.
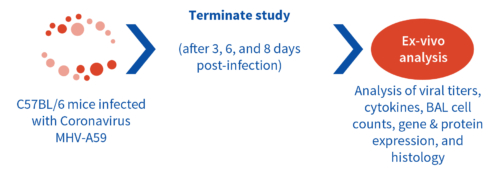
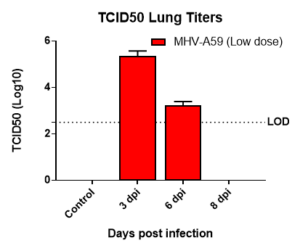
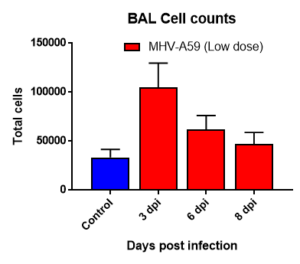
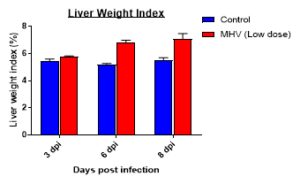
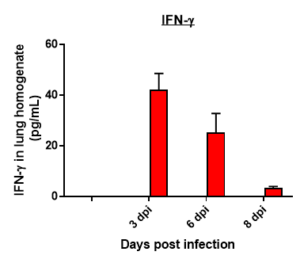
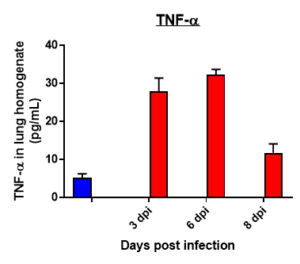
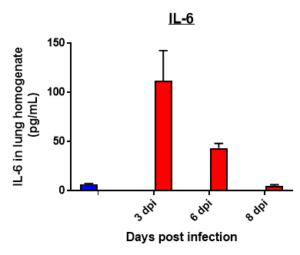
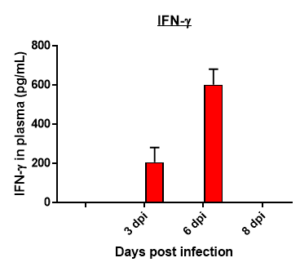
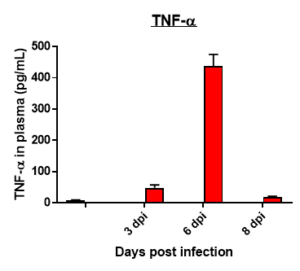
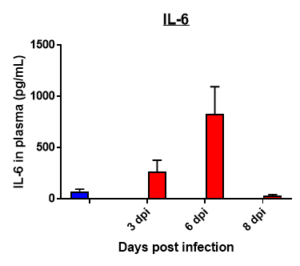
Results: We measured MHV-A59 viral load in lungs and in BAL cell counts (dpi) post infection with MHV-A59 (days 3-8) and analyzed 29 cytokines/chemokines. Viral load (TCID50) increased after 3 days post infection decreased on 6th and 8th day. Similar trend in BALF cell counts was seen after 3rd, 6th and 8th days. In this model, we observed that IL7 was significantly induced by MHV infection, which is like SARS-CoV-2-induced upregulation of critical cytokines often seen in COVID patients. Therefore, this mouse model serves as a surrogate SARS-CoV-2 model that can be studied in BSLII set up unlike BSLIII requirements for studies involving SARS CoV-2 models.
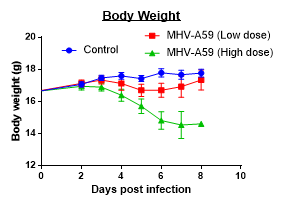
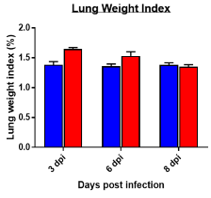
Changes in Body, Lung, Liver weights post MHA-A59 infection in mice
Cytokine profile changes seen in mice lung homogenates post MHA-159 infection
Cytokine profile changes seen in mice plasma post MHA-159 infection
Fibrosis -specific gene Expression in Lung Tissue
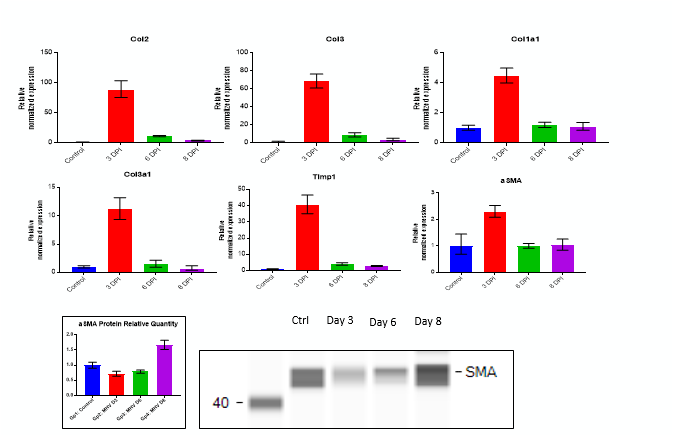
Fibrosis -specific gene Expression in Liver Tissue
Our rodent asthma models include induction by ova or other allergens (cedar pollen, dust mote antigen). Models might range from mild to severe disease, to evaluate a range of treatment options.