
Obesity is a multifaceted metabolic disorder that extends beyond excess fat accumulation. However, the accelerated loss of skeletal muscle that may accompany it—sarcopenic obesity—remains underdiagnosed and under investigated. Many individuals with obesity experience progressive muscle deterioration alongside fat accumulation, underscoring that obesity is not solely an adiposity-driven condition but also involves significant impairments in muscle health.
To address this unmet need, Aragen’s obese murine models provide a scientifically robust and translational framework to study obesity-induced sarcopenia, illuminate disease mechanisms, and enable evaluation of targeted metabolic, anti-inflammatory, and muscle preserving interventions.
Aragen’s Obesity-Induced Sarcopenia Mouse Model reproduces the combined phenotype of excess adiposity and progressive muscle deterioration using a controlled and translational in vivo model. Obesity is induced through a high fat diet (60kcal% from fat) to achieve robust weight gain relative to lean controls. The model integrates Time-Domain Nuclear Magnetic Resonance (TDNMR) body composition readouts (fat mass %, lean mass %, fluid mass %) with functional muscle assessment (grip strength) and longitudinal monitoring of disease progression. By capturing key hallmarks of human obesity associated sarcopenia—increased fat deposition, elevated fluid mass, reduced lean mass, and impaired muscle strength—this platform provides a reproducible, decision ready basis for evaluating metabolic, anti-inflammatory, and muscle preserving therapeutics.
After 14 weeks of high‑calorie feeding, obesity became visibly evident in the test group compared with the lean controls, and this separation continued to intensify throughout the study. The obese cohort showed an early and sustained upward shift in body weight (Figure 1A), with clear separation of group means and tight within‑group variance (p<0.0001). This consistent divergence reflects uniform induction of the obese phenotype and establishes a strong baseline for interpreting subsequent TD‑NMR body‑composition changes, functional muscle performance, and longitudinal progression of obesity‑induced sarcopenia.
Fat Mass Distribution Across Groups
Fat mass percentage was substantially higher in obese mice than in lean controls (Figure 1B, p<0.0001), with minimal intergroup overlap. This pronounced adiposity confirms the efficacy of the high‑calorie feeding regimen and provides a sensitive endpoint for quantifying anti‑obesity effects and body‑fat remodelling.
Fluid Mass Profiles in Lean and Obese Mice
Obese animals exhibited an elevated fluid mass percentage compared with lean controls, reflected by an upward displacement of the group mean (Figure 1C, p < 0.0001). This shift captures obesity‑associated changes in fluid balance and broadens the physiological scope of the model beyond adiposity and muscle metrics.
Lean Mass Assessment and Muscle Composition
Lean mass percentage was reduced in the obese cohort relative to controls (Figure 1D, p < 0.0001), indicating relative depletion of muscle content against total body mass. The clean intergroup separation supports detection of muscle preserving pharmacology and aligns with a sarcopenic profile embedded within the obese state.
Functional Decline in Grip Strength
Obese mice exhibited reduced grip strength compared with lean controls (Figure 1E, p < 0.0001), demonstrating measurable impairment in skeletal muscle performance. This functional decline mirrors the structural reduction in lean mass (Figure 1D) and enables integrated assessment of both structural rescue and functional recovery in response to therapy.
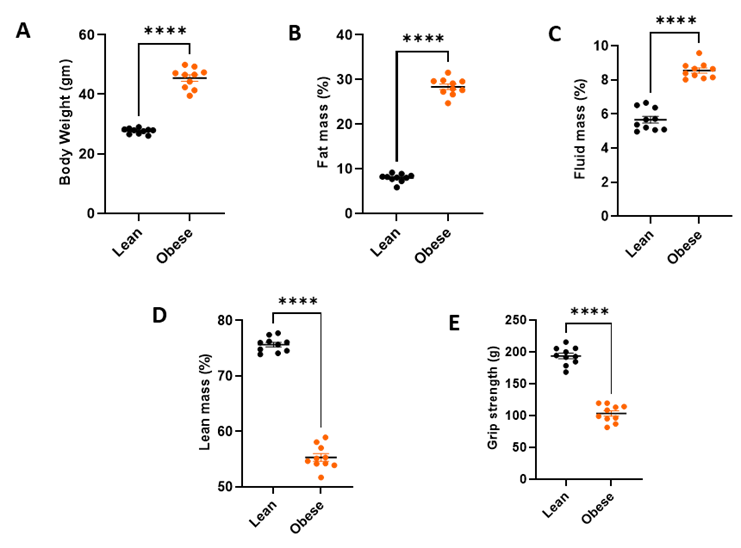
Figure 1 : Body composition and muscle function parameters in lean and obese mice.
(A) Obese mice exhibit significantly higher body weight compared with lean controls. (B) Fat mass (%) is markedly elevated in obese animals, confirming robust adiposity induction. (C) Fluid mass (%) is increased in obese mice, indicating obesity‑associated shifts in fluid balance. (D) Lean mass (%) is reduced in obese animals, reflecting loss of relative muscle content. (E) Grip strength is significantly lower in obese mice, demonstrating impaired skeletal muscle function. All parameters show clear separation between groups, highlighting the structural and functional characteristics of obesity‑associated sarcopenia (**** p < 0.0001).
Aragen’s model reliably captures the dual progression of diet‑induced obesity and associated muscle deterioration, demonstrating clear and consistent divergence between lean and obese cohorts across all key endpoints. The coordinated shifts in body composition—increased fat and fluid mass alongside reduced lean mass—occur in parallel with a measurable decline in muscle strength, reflecting the hallmark features of obesity‑associated sarcopenia. This cohesive phenotype provides a robust and translational platform for evaluating therapies that target adiposity, preserve muscle integrity, and improve functional performance, enabling confident decision‑making for mechanism differentiation and program advancement.
Ready to evaluate your candidate in an obesity‑induced sarcopenia model?
Get in touch with us to discuss tailored study options and next steps.