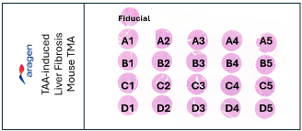
TMA allows for the simultaneous analysis of progression of a disease, under identical and standardized conditions on a single glass slide. In this study, liver fibrosis was induced with TAA.
A1-A5: Normal water
B1-B5: 6 weeks TAA treatment
C1-C5: 9 weeks TAA treatment
D1-D5: 12 weeks TAA treatment
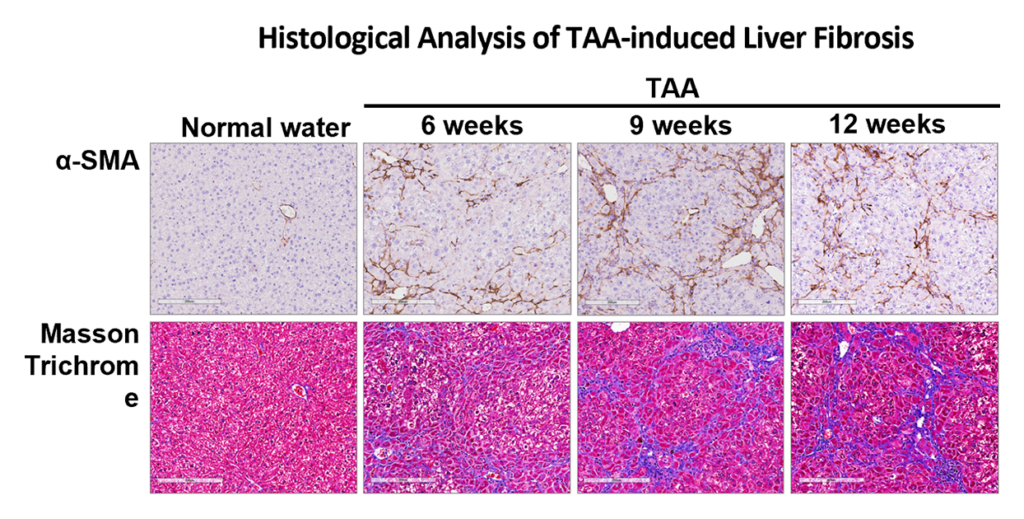
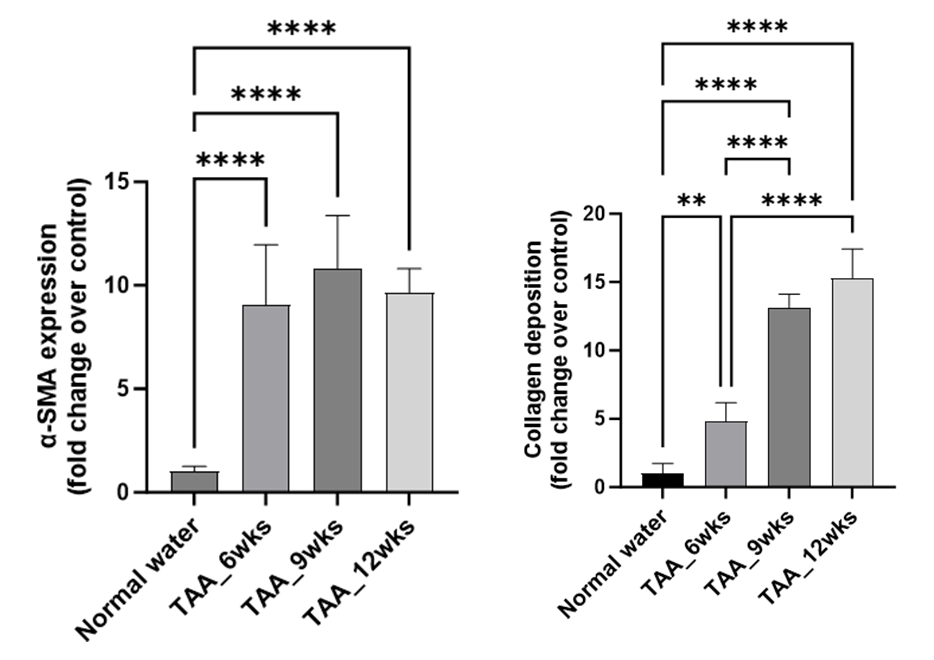
Livers from mice receiving TAA at 6, 9, and 12 weeks showed increased α-SMA expression
Livers from mice receiving TAA at 9 and 12 weeks showed increased collagen deposition and bridging fibrosis, a typical feature of F3 fibrosis